Investing The OVBE Way/digital-wall-st/1093/march-ovbe-wealth-building-newsletter/public/sitereview_listing/14/3e/02/62d01b7f2d22277327e0d385a6ede6e6.jpg
Investing The OVBE Way/digital-wall-st/1122/april-ovbe-wealth-building-newsletter/public/sitereview_listing/1e/43/02/5089f18dbdcf78c98d01088bad86bc65.jpg
Investing The OVBE Way/digital-wall-st/1136/may-20-ovbe-wealth-building-newsletter/public/sitereview_listing/a6/44/02/47b16d5b94afee80e33192a8456c2bbd.jpg
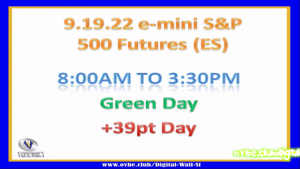
Monday September 19, 2022 the e-mini S&P went up 39 points, closing positive for the day Watch the indicators during the up trends and down trends, notice which indicators move just before the direction of the trend. The goal should be to get in and out as trends reverse. The trading hours captured was from 8:00am to around 3:00pm, which in my opinion are the core hours with the most volume.
The uptrend starts around: 2:00, then it goes down a little and starts to climb again.
The video has been accelerated so viewers can see the trends form in the indicators. The top 3 indicators are my pre-trend indicators, followed by confirmation and volume indicators.
*Freebie, for further in depth analysis, join www.ovbe.club as premium member. The WHITE up/down arrows are "TTM Scalper Alerts", they are supposed to signify possible buy and sell opportunities.
The 5th indicator from the top has the "Vortex Indicator" overlaid on the "Balance of Market Power". The BOMP indicates the trend of whether buyers or sellers are in control, red bars(sellers), green bars(buyers). As trends reverse or begin, notice if the buyers or sellers are in control. I always try to short as close to the top of the candle as I can when sellers are in control, and buy as close to the bottom of the candle when buyers are in control. 1/2pt to 1pt scalps in and out. Happy trading, study, and STAY FOCUSED.